A Transformation Story
A Tokyo-based fashion brand that turned a struggling homepage into their highest-performing acquisition channel.
Bloom & Thread
The Challenge
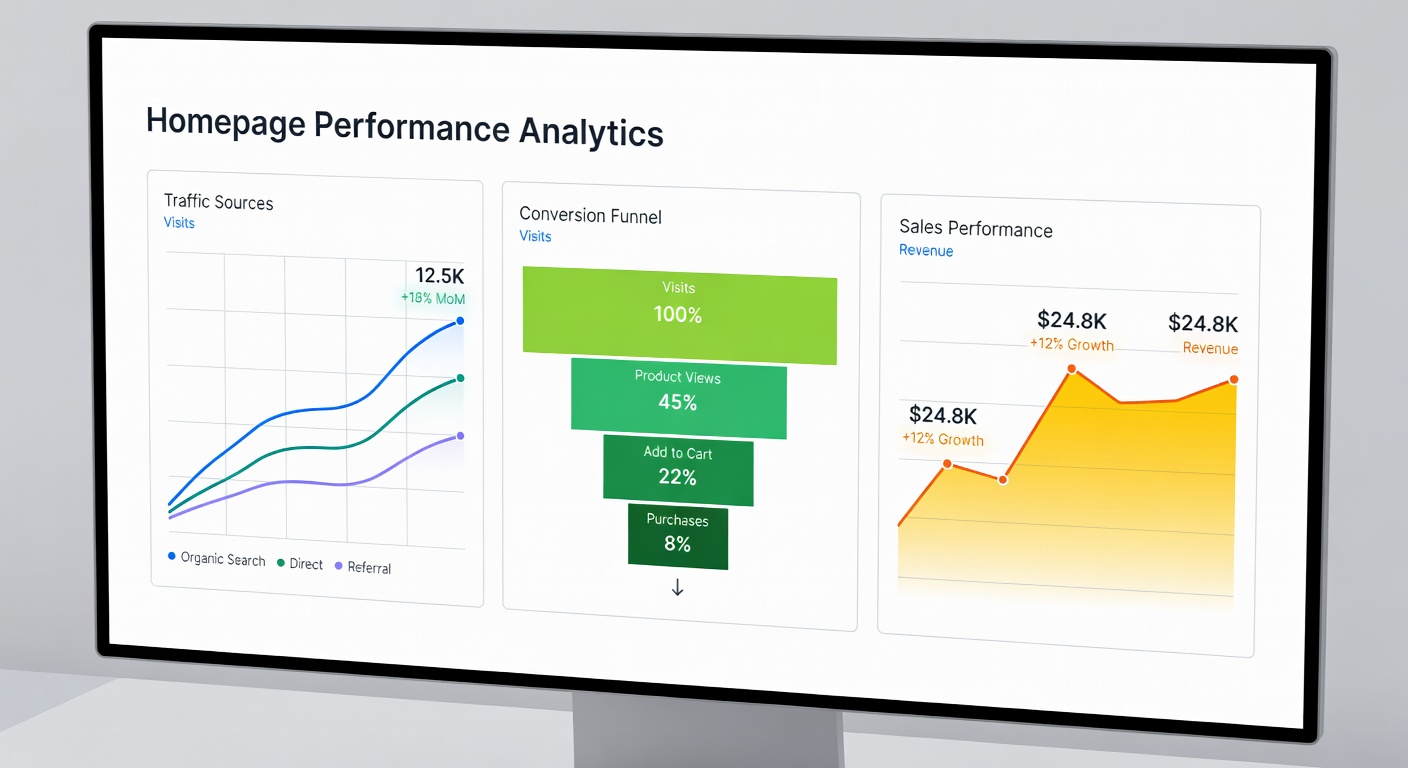
Bloom & Thread had a beautiful product range but their homepage wasn't telling that story. With a 4.2% average homepage bounce rate and near-zero organic product discovery, customers were landing and leaving within seconds. The navigation was confusing, the hero section lacked a clear value proposition, and there was no social proof visible above the fold.
Modules Applied
The Approach
We ran a full 47-point framework audit and identified three critical failures: an unclear hero CTA, buried category navigation, and zero social proof in the first 600px. After implementing the HomepageFrame system over three weeks, the results arrived within the first full billing cycle.